
Happy Finter from South Louisiana! Fall started to show up, but winter was riding shotgun! We went from highs of 81 degrees F / 27.22 degrees C to 45 degrees F / 7.22 degrees C AND clouds and rain. Christmas light show can wait a few more days to get set up.
Today we are going to go over Data Frequency and how it relates to aspects of drilling automation. How often we receive a data point for a given channel or curve.
Variations on Real Time
Ask someone what their definition of real time is and depending on their particular needs, you will get different answers. Some people feel that getting mud report data as checks are made is real time enough to keep them informed.
Others feel that getting a WITSML 1.3.x, (Wellsite Information Transfer Standard Markup Language), data feed that updates every ten to thirty seconds will be just fine.
Then there are others who are used to seeing the rig default of data coming in every 5 seconds and that is great!
Finally, there are those who opine for sub-second data frequencies to ensure valid tracking of rig component movement and calculations.
Depending on your particular needs, any of these might be valid. For a comprehensive approach, the platform should take into account the needs and requirements for the types of data being captured. It should be able to accommodate sensors or inputs that generate anything from one data point per day down to many data points per second.
(Just as an aside, I really like the way WITSML 2.x and ETP are shaping up for real time data)
I would like to know more about my readers. If you could spare about 2 minutes of your time, please take a survey to tell me what you like about the blog. Just click here to take the survey.
Data Frequency
The type of data should drive the frequency of data capture, in addition to what the usage of the data will be.
Some data doesn’t change very fast, so it does not need to be updated very frequently.
Things like wellbore and drill string geometry, fluid properties, and positioning data do not need to be updated every second or few seconds. In the case of drilling fluids, Density updates every one to two minutes is a decent frequency, whereas the oil/water ratio does not need to be updated as frequently.
Other data is constantly changing and depending the particular sensor, could indeed warrant the need for sub-second frequency data.
A good example for that need would be block position, which is used to calculate running speed or pipe acceleration. This is, in turn, utilized to calculate tripping hydraulics in real time.
The benefit of having the ability to do this based on sub-second data allows for simulating the micro-movement of pipe in tight window scenarios…too much down hole pressure, the formation breaks down, causing fluid losses and too little down hole pressure, the formation fluids/gases come into the wellbore, thus inducing a kick.
Logical Assumptions & Why It Matters
Not all data needs to be updated at a high frequency. As indicated in the above section, data frequency depends on how often the data changes. The higher the change rate, the higher the data frequency needs to be.
The main reasoning behind this idea is that you may miss significant changes in the data if your sampling frequency is too slow.
Below is an exaggerated example of missing changes to pipe acceleration (or Running Speed) due to sampling frequency. The data is fabricated, for illustrative purposes.
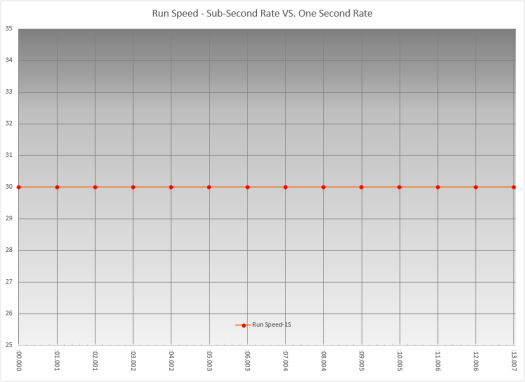
In the image above, the running speed is a straight thirty feet per minute, with a data frequency of one data point per second. Everything appears smooth, with no issues.
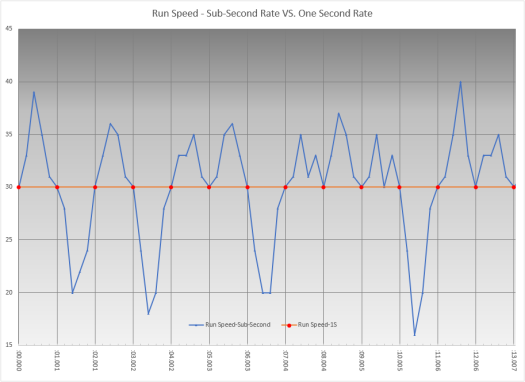
In this image, I’ve added sub-second data to show that the smooth, steady running speed was actually not very smooth, it just appears that way due to when the data points were captured.
Because this data is not captured, it is not thought to have occurred. But if you don’t have visibility of it, you can’t know it is there.
The examples above are made up & exaggerated to prove the point. I have seen this play out over different data points in the drilling arena.
When we were first attempting to develop the Applied Fluids Optimization service, our original software would calculate tripping hydraulics at a one second frequency, but would only capture the data at a thirty second frequency. Running speed spikes would lead the software to calculate and display large pressure variations. When we would try to show these excursions after the fact, we could not because the thirty second frequency did not coincide with the actual deviations.
One more fluids-related example: Fluid density on a land rig. Land rigs are an exercise in economy, from an offshore drilling perspective. The rig crews are smaller, so there are less people to do a set number of jobs. The mud pits are smaller, contributing to the total circulating system being smaller. Because of this, it allows for less significant events to impact the fluid properties. The derrick hand is busy? He can’t dust up the density. The shaker hand is up on the floor making a connection? He didn’t adjust the flow on the shakers. Small system, less attention, more chance for changes.
The mud engineer, (person responsible for keeping the drilling fluid running within specifications), should be running four mud checks a day. So, we should see, at minimum, four density measurements…one every six hours. When we were conducting field testing on the DRU, we noticed that we had lots of variation and excursions in the density reading from the DRU where the mud engineer’s data showed fairly smooth trends. When we overlaid the two data sets, the mud engineer’s data matched almost exactly with the DRU readings, just that it missed the excursions.
Takeaways
- More frequent data helps you to better understand what is going on
- Depending on the environment, a data curve may need a higher frequency
- Some data does not need to be high frequency
- Choose your data focus wisely
And, as always, let me know what you think in the comments. Ask questions, tell your story.
If you like my posts, please share them with others and subscribe to this blog.
Discover more from The Clint Galliano
Subscribe to get the latest posts sent to your email.