Automation – Fluids Automation: A Primer

This article was originally posted on SOURCEZON‘s Knowledgebase.

I was asked to write a series of articles covering Fluids Automation, real time hydraulics, and automated fluid property sensors for addition to the knowledgebase at a friend’s company. I decided to cross-publish it here and plan to do the same with the other articles in the series. Please let me know what you think about it.

This is the first in a series of articles on Fluids Automation and associated topics. The intent is to provide some background and a current state of the topic in the industry. The plan is to cover General Fluids Automation in this article, then follow with articles on real time hydraulics software and automated fluids testing equipment.

Fluids Automation is a subject that covers segments including equipment, software, and services. It is mainly focused on the automation and enhancement of manual processes of fluids maintenance and optimization with regard to drilling and completing oil and gas exploration wells. 

Fluids Background

Traditionally, fluids are maintained by a technician commonly referred to as a “Mud Engineer”, “Fluids Engineer”, or “Completion Fluids Engineer”. They are responsible for maintaining physical and chemical properties of the particular fluid(s) being used, tracking fluid volumes, wet and dry chemical inventory, and making recommendations for drilling operations to maintain downhole pressures within the “Goldilocks Zone”. 

The Goldilocks Zone is where the pressure is less the amount needed to fracture the formation, which could lead to fluid losses, and more than the amount needed to balance the formation pressure, thus keeping the formation fluids from entering the wellbore and potentially causing a catastrophic “kick” situation. 

Part of maintaining the physical and chemical properties involves conducting tests. Some are as simple as filling the cup on a mud balance, taking the temperature with a thermometer, or heating the fluid to a set temperature then using a rheometer to determine how the fluid reacts under levels of shear stress; whereas others are as complex as extracting filtrate from the fluid under pressure, then conducting various chemical titrations to determine the chemical properties. 

In addition to testing, Fluids Engineers also must run hydraulic simulations under various operational conditions to confirm that the fluid’s current property set does not cause an excursion of down hole pressures outside of the Goldilocks Zone. 

This does not take into account the time spent on doing reports, actually counting inventory, attending daily safety and operational meetings, participating in evacuation drills, overseeing fluid treatments, and any special rig operations like cement jobs or displacements. 

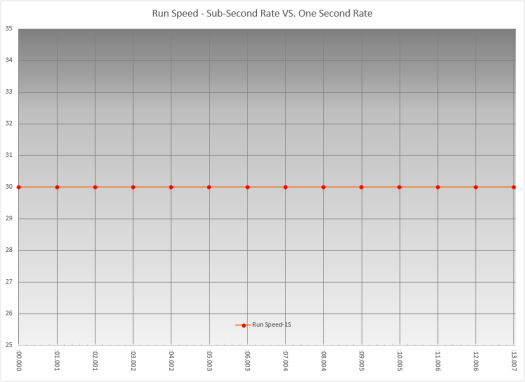
For a twenty-four (24) hour day, a minimum of six (6) hours can be taken up by conducting the basic tests for a non-aqueous fluid, assuming one check each of the fluid going in and out of the hole every twelve hours. That is twenty-five percent (25%) of the day consumed by just testing.

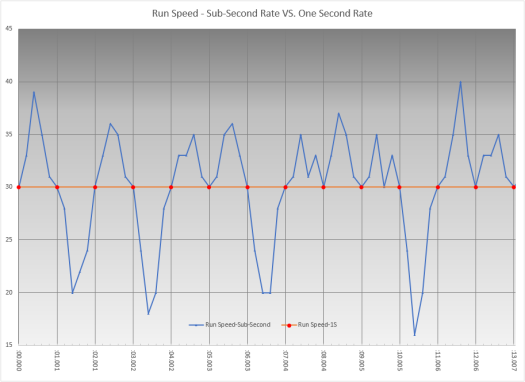
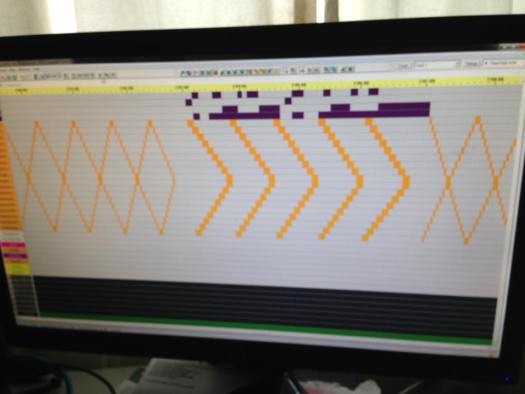
For those six hours, you get four snapshots of what is going on with your circulating fluid system. To possibly make things easier to visualize, imagine your fluid system as a timeline that repeats every twenty-four hours. You get to see what is happening at 08:00, 12:00, 20:00, and 00:00, every day. 

That would be fine if you had a homogeneous fluid system. The problem is that most systems are not. Whether caused by “dusting up too much” or dumping all of the treatment in at the end of the tour (shift) instead of continuously feeding it in, this causes a variation in the system. And with only four snapshots a day, it is hard to determine if this is going on. This could lead to over or under treating the fluid depending on the representative sample that was tested. If the treatment was put in all at once and the sample represented that situation, then the treatment recommendation might be to either not treat, because the properties tested where they should be or to treat to reduce the properties, because they are too high. In either situation, the rest of the fluid set does not represent the sample tested, it gets no treatment or the wrong treatment. Luckily, experienced fluids engineers conduct spot checks to verify specific properties in between running the full fluid checks.

Fluids engineers also do hydraulic simulations, based on fluid properties and current or proposed drilling parameters, to determine downhole pressures, cuttings loads, (the volume of cuttings drilled and still being carried within the wellbore), and safe tripping speeds, (how fast you can move the drill pipe or casing in the wellbore without getting out of the Goldilocks zone of pressure; think of it like a syringe plunger). This used to be calculated by hand many years ago, but is now simulated by software. The fluids engineer is able to do multiple snapshot simulations based on different inputs, providing options for a go-forward plan. This software has the ability to simulate how long it would take for cuttings being generated at the start of the simulation to be carried out of the wellbore. This allows users to “see ahead of the bit”, understanding what their hydraulics and cuttings loads might look like under the inputted parameters.

Fluids Automation

The idea for fluids automation has been around for years. Companies have tried to develop “black box solutions” at a time when the required computing power was just not there. This resulted in limited outputs and only narrow scoped scenarios being able to be handled. 

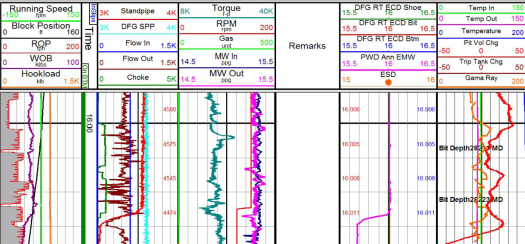
Fast-forward to the aughts (2000-2010), where significant progress was made on developing accurate real time hydraulics software. This software was able to provide the same information that a fluids engineer’s snapshot simulations could provide, but instead of repeatedly inputting minor changes to the drilling parameters, it received a real time data feed from the rig operations. This allowed for continuous simulation of down hole pressures that real time actual measurements from PWD, (Pressure While Drilling tool), could be compared to. 

These early versions would just run continuous snapshots based on manually entered fluid parameters. It would not reflect changes in density until the software operator received notice that the density had changed. This would lead to differences observed when comparing the measured down hole pressure to the simulated pressure because the actual measurement would change as soon as the density started to change, while the real time hydraulics software output would not change until a new density was entered. 

Another limitation was that only a single wellbore fluid could be simulated at a time. This presented issues when pumping sweeps or doing displacements, causing those situations to not be modeled correctly.

There were other issues in how the cuttings were treated in the simulation. Since results were a series of snapshots, it did not take historical actions into account. If the rig stopped pumping, the simulation assumed no change during that time, then started from where it left off when the pumps came back on. It did not reflect cuttings migrating down the wellbore during this lack of flow.  

More recent generations of real time hydraulics software have all but eliminated these issues. They can still provide the snapshot lookahead, but additionally track cuttings transport in the wellbore over time, taking into account migration when not pumping. They also handle multiple fluids in the wellbore, pipe rotation effects on ECD, and gel structure effects on rheology. 

As implied above, fluid properties have an impact on down hole pressures, otherwise known as ECD (Equivalent Circulating Density), the down hole pressure when circulating or ESD (Equivalent Static Density), the down hole pressure when static or not circulating. The biggest influencers are density and rheology. Changes to these properties have the biggest impact on downhole pressures. 

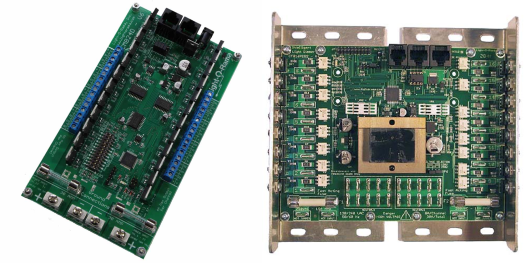
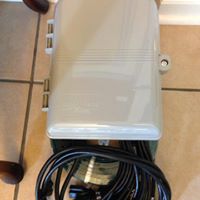
Having automated sensors for density and rheology allow for data frequency to better reflect how the fluid system varies as it is being circulated through the system. The key is to have accurate API-specific measurements that can be consumed by the real time hydraulics software. This allows for the measurements to be utilized by any software or calculation that relies on API density and rheology as inputs. 

This fluids data can also be combined with the rest of the real time data from the rig to determine several things: 

  • What is currently going on (on the rig)? 
  • Is it being done as efficiently as possible? 
  • Are there any hazards occurring or likely to occur in the near-term?

Currently, these things are determined by trained specialists who monitor the data twenty-four hours a day. This allows them to pay attention to a maximum of three jobs, when operations are running smoothly. This capacity drops as soon as operations or events become difficult, requiring more focus from the individual.

Eventually, when the right minds get together, these questions will be able to be answered by algorithms. This will allow a single specialist to monitor ten or more jobs simultaneously, increasing capacity and efficiency. 

Such is the state of Fluids Automation as of the summer of 2020.

And, as always, let me know what you think in the comments. Ask questions, tell your story.

If you like my posts, please share them with others and subscribe to this blog.

Automation – Stessa Rental Property Accounting

Today I am going to do a review of Stessa, an online rental property accounting platform.

But first, a disclaimer:

***This review may contain affiliate links that compensate me for user registrations of this product.***

As I have detailed in a previous article, I started using Stessa last year to track accounting for our rental portfolio. Previously, we used Google Sheets, tracking rental income and expenses for each property on different tabs. This would involve me going in to the first property’s income tab, entering the collected rent, then checking all of my receipts and accounts to verify I hadn’t missed any expenses and adding them to the expense tab for that property. I set up expense categories and put in a section to summarize the expenses by category and by month. While not ideal, it insured that someone at my CPA’s office was not classifying an expense in the wrong category or for the wrong property. It was not hard to do, just more a matter of remembering to do it.

Around the middle of 2018, I started seeing advertisements for a product called Stessa on Facebook. As per my SOP, I ignored them, other than taking note of the name. A few weeks after first seeing the ads, I heard an advertisement for it on The Bigger Pockets Podcast. This was more effective, as they pointed out how it was free for rental property owners and individual investors and involved some automation to keep track of your accounting. They also pointed out how the product was developed by real estate investors for real estate investors and the name was “assets” spelled backwards.

I went to the web site and registered for it. I was able to set up our properties and import bank & credit card histories to the transactions section, allowing me to categorize each expenditure. It took maybe 10 minutes to set up two properties. And, once numbers had been entered, the dashboard populated with portfolio metrics. Way nicer than my spreadsheets!

Features

Individual tracking for each property:

Property Profile Header – Address, Acquisition Date, and Cost.

Property Details – (Year built, neighborhood, parish [county, for those of you outside Louisiana], number of units, bedrooms, bathrooms, square footage, and lot size, all pulled from Zillow, based on the address.)

Valuation – Provides for multiple options: Custom Valuation, Zillow Zestimate (automatically polled, user choice to update property valuation), Gross Rent Multiplier, or Capitalization Rate.

Rent Roll – Allows entry of Bed/Baths, Square Feet, Tenant names, Rent, Market Rent, Deposit, Move-in Date, Lease Expiration Date, and notes.

Property Notes section – Freeform note space for property.

Monthly Expenses – Allows for Pro-Forma expense entry and pulls in categorized expenses from the Transactions section to show actuals compared to Pro-Forma.

Neighborhood – Shows location on a Google map, with a Walk Score and a Bike Score for the property.

Assessments – Pulls in assessed value and property tax amount (I’m assuming from Zillow), and allows you to add missing assessment/tax details.

Capital Expenses – Allows for entry of Date, Description, & Amount of Capital Expenditure.

Loan-to-Value – Shows a chart with LTV percent, Property Value, Debt (principal balance), and number of loans.

Mortgage – Details the Lender, Principal Balance, Payment Amount, and Interest Rate.

Insurance – Displays the Carrier, Premium, Policy Number, and Renewal Date.

Transactions:

As I mentioned above, Stessa allows you to link bank accounts and credit cards to the Transactions ledger. It lets you initially import all transactions and gives you the option to review them to either categorize each one correctly or, in my case, the credit card I use also has personal charges, so it it allows me to delete those transactions.

Stessa does not store your credentials on their servers and use bank-level encryption to secure the transfer of information. It also does not allow changes to your bank or credit card accounts. It only pulls a copy of your transaction information.

The Transaction Ledger Menu allows you to review new transactions, view ALL PROPERTIES transactions, view individual property transactions, or add a new property.

The main Transaction Ledger display shows all transactions, filtered, based on the menu selection. It additionally allows you to search by keyword and/or filter by Date, Category, Amount, or Account.

There is also an export function, allowing you to export filtered transactions to a *.csv file.

You can manually import *csv and *.qif files from accounting software, in addition to adding individual transactions by hand, such as mileage.

Reporting – Reporting is one of the reasons I was interested in trying out Stessa in the first place. It provides you with standard reports such as Income Statements, Cash Flow, and Capital Expenditures, with options to select a date range, property/portfolio, monthly breakout, and whether or not to show Category Details. The report is downloaded as an Excel file, allowing you to customize the report title and report formatting, if needed.

The other reporting option I have mentioned before is the Tax Package. This contains everything needed to hand off to your CPA at tax time. And it sure makes it easier on me!

Click on this link to get your own free copy of the Rental Property Tax Guide by Stessa.

Dashboard

The dashboard is the main page you see when logging in on a computer. It allows you to show the total portfolio or to select individual properties.

It contains the following sections:

Portfolio Value – Options to see Market or Purchase Value.

Asset Return – Either Appreciation or Levered returns.

Occupancy – Detailed in percent.

Income

Cash Flow

Unit Count

Property Count

Debt – Total

Net Cash Flow – A chart detailed by month & Category

Location – Google map showing all properties in Portfolio View or a single property in Property View

Compare Properties – Rental Income, Market Value, and Square Feet. Available in Portfolio View only

Property Highlights – Property picture from Google Street View, Income, Expenses, LTV, and Occupancy. Available in Property View Only

Summary

I think that Stessa is a great automation tool for rental property accounting. It’s free, cuts down on time spent doing bookkeeping, and makes tax time easier. On top of that, their user support is outstanding! Early on, I identified a couple of bugs and they were fixed within a couple of days. Amazing!

If you are interested in trying out Stessa for your rental properties, please click on the link below:

Stessa Rental Property Accounting

And, as always, let me know what you think in the comments. Ask questions, tell your story.

If you like my posts, please share them with others and subscribe to this blog.

Automation – Data Frequency: How “Real Time” Is Real Time?

Happy Finter from South Louisiana! Fall started to show up, but winter was riding shotgun! We went from highs of 81 degrees F / 27.22 degrees C to 45 degrees F / 7.22 degrees C AND clouds and rain. Christmas light show can wait a few more days to get set up.

Today we are going to go over Data Frequency and how it relates to aspects of drilling automation. How often we receive a data point for a given channel or curve.


Variations on Real Time


Ask someone what their definition of real time is and depending on their particular needs, you will get different answers. Some people feel that getting mud report data as checks are made is real time enough to keep them informed.

Others feel that getting a WITSML 1.3.x, (Wellsite Information Transfer Standard Markup Language), data feed that updates every ten to thirty seconds will be just fine.

Then there are others who are used to seeing the rig default of data coming in every 5 seconds and that is great!

Finally, there are those who opine for sub-second data frequencies to ensure valid tracking of rig component movement and calculations.

Depending on your particular needs, any of these might be valid. For a comprehensive approach, the platform should take into account the needs and requirements for the types of data being captured. It should be able to accommodate sensors or inputs that generate anything from one data point per day down to many data points per second.


(Just as an aside, I really like the way WITSML 2.x and ETP are shaping up for real time data)

I would like to know more about my readers. If you could spare about 2 minutes of your time, please take a survey to tell me what you like about the blog. Just click here to take the survey.

Data Frequency

The type of data should drive the frequency of data capture, in addition to what the usage of the data will be.

Some data doesn’t change very fast, so it does not need to be updated very frequently.

Things like wellbore and drill string geometry, fluid properties, and positioning data do not need to be updated every second or few seconds. In the case of drilling fluids, Density updates every one to two minutes is a decent frequency, whereas the oil/water ratio does not need to be updated as frequently.

Other data is constantly changing and depending the particular sensor, could indeed warrant the need for sub-second frequency data.


A good example for that need would be block position, which is used to calculate running speed or pipe acceleration. This is, in turn, utilized to calculate tripping hydraulics in real time.

The benefit of having the ability to do this based on sub-second data allows for simulating the micro-movement of pipe in tight window scenarios…too much down hole pressure, the formation breaks down, causing fluid losses and too little down hole pressure, the formation fluids/gases come into the wellbore, thus inducing a kick.


Logical Assumptions & Why It Matters


Not all data needs to be updated at a high frequency. As indicated in the above section, data frequency depends on how often the data changes. The higher the change rate, the higher the data frequency needs to be.

The main reasoning behind this idea is that you may miss significant changes in the data if your sampling frequency is too slow.

Below is an exaggerated example of missing changes to pipe acceleration (or Running Speed) due to sampling frequency. The data is fabricated, for illustrative purposes.


RunSpd-1s


In the image above, the running speed is a straight thirty feet per minute, with a data frequency of one data point per second. Everything appears smooth, with no issues.


RunSpd-SSv1s


In this image, I’ve added sub-second data to show that the smooth, steady running speed was actually not very smooth, it just appears that way due to when the data points were captured.


Because this data is not captured, it is not thought to have occurred. But if you don’t have visibility of it, you can’t know it is there.


The examples above are made up & exaggerated to prove the point. I have seen this play out over different data points in the drilling arena.

When we were first attempting to develop the Applied Fluids Optimization service, our original software would calculate tripping hydraulics at a one second frequency, but would only capture the data at a thirty second frequency. Running speed spikes would lead the software to calculate and display large pressure variations. When we would try to show these excursions after the fact, we could not because the thirty second frequency did not coincide with the actual deviations.

One more fluids-related example: Fluid density on a land rig. Land rigs are an exercise in economy, from an offshore drilling perspective. The rig crews are smaller, so there are less people to do a set number of jobs. The mud pits are smaller, contributing to the total circulating system being smaller. Because of this, it allows for less significant events to impact the fluid properties. The derrick hand is busy? He can’t dust up the density. The shaker hand is up on the floor making a connection? He didn’t adjust the flow on the shakers. Small system, less attention, more chance for changes.

The mud engineer, (person responsible for keeping the drilling fluid running within specifications), should be running four mud checks a day. So, we should see, at minimum, four density measurements…one every six hours. When we were conducting field testing on the DRU, we noticed that we had lots of variation and excursions in the density reading from the DRU where the mud engineer’s data showed fairly smooth trends. When we overlaid the two data sets, the mud engineer’s data matched almost exactly with the DRU readings, just that it missed the excursions.


Takeaways

  • More frequent data helps you to better understand what is going on
  • Depending on the environment, a data curve may need a higher frequency
  • Some data does not need to be high frequency
  • Choose your data focus wisely


And, as always, let me know what you think in the comments. Ask questions, tell your story.

If you like my posts, please share them with others and subscribe to this blog.

Business – Optimizing A Process – Order of Operations Related to Surgery:

This week I am touching on the topic of process optimization. This is another topic that came a conversation between Kevin@deliberateconsulting.com and myself when comparing thyroidectomy procedure results and side effects. He was diagnosed with thyroid cancer and had surgery a couple of months prior to my diagnosis.

Process-Optimization

We compared notes on what was similar and what was different between the two.

(Caveat: There may be some factors that we are not aware of, specific to each of us as individuals, that could have influenced decisions made.)


We both had thyroidectomies. Surgery, an overnight stay. A vacuum bulb to drain the incision area. Released the next morning. Then wait to determine if further treatment is necessary to ensure the eradication of cancer. In Kevin’s case, he needed further treatment, in my case, it is too soon to tell.

The doctors started Kevin on hormone replacement therapy almost immediately after surgery, then had to wait for levels to drop to begin the secondary treatment. I am still not on any replacement hormones until they determine if I need the radioactive iodine ablation, thus shortening the cycle time to start. Since the hormones appear to last about 6 weeks, I am good for a while with no replacements and won’t have to wait for levels to deplete if I do need the RAI.

The way my surgeon planned things seems to be the more efficient way to do things. This got me thinking about how an optimized process for business is cheaper and more efficient than just randomly doing things in a haphazard manner.


I do this in my real estate investing. When rehabbing a property, I evaluate what needs to be done & plan the order of operations so that there won’t have to be re-work because something had to be undone to do something else.


You can look at your business processes and optimize them for efficiency by ensuring the order of operations for each step does not additionally delay some other step.


You can think of it like the sandwich-making analogy I used here…if your current process calls for you to put the peanut butter on the plate, then add the bread, then the jelly or jam, you can optimize it by changing the order of operations to bread, peanut butter, jelly, then another slice of bread.


What inefficient processes have you identified in your business or workplace? How did you change them?


And, as always, let me know what you think in the comments. Ask questions, tell your story.


If you like my posts, please share them with others and subscribe to this blog.

Automation: Good Signs Ahead for Automation in the Oil & Gas Industry?


I would like to know more about my readers. If you could spare about 2 minutes of your time, please take a survey to tell me what you like about the blog. Just click here to take the survey.


AFOPlot1
Hydraulics-Focused Drilling Data


This week is a quick post about what may be an interesting trend in the US Land Oil & Gas Sector…Interest in Automation and Optimization technologies to increase efficiencies. I have a theory on why. AND, #Disclaimer, I mention the service offering I work with.


Historic Interest in Automation


Historically, there are always early adopters for technology, and the oilfield is no different. You have a few entities that want to be on the cutting edge of everything, a few tire kickers, and the majority don’t want to spend any money until something is proven to them. Such is the case with automation and optimization, from the perspective of the offering we have (BaraLogix Equipment & Services).


Offshore


We initially provided the optimization and event detection service offshore. This was before the equipment was ready to ready to be deployed commercially. Actually, it was still in development. We had a few jobs here and there, but not a lot of buy-in. Even with customers that benefitted from significant value from it, it seemed the response was always something similar to “Maybe you actually did help us achieve our goals, but maybe it was something else…” or “We don’t have the authority to sign off on this case history saying that you brought us value.”

So we did jobs here and there, but  there was never a consistency to the work.


Land


As far as land work was concerned, due to different economics, the service was always outside the client’s budget. In fact, the only time we did provide the service on land, at least in the US, was when conducting trials of the equipment.


Fast-forward to today…


We now have customers in the US Land area that are interested in what the service and equipment can provide them. There are three jobs starting up in the next three weeks or so that are a mix of the combined equipment & services or just the standalone service.


My thoughts jump to “Why now?”


What I suspect is that over the last 3-plus years, operators have been increasing their efficiencies to stay relevant at lower oil prices. And possibly they have plateaued. Now, they want to take that next step and increase efficiencies even more. I think that may play a big part in the sudden interest in our equipment and services.


What do YOU think could be driving this?


And, as always, let me know what you think in the comments. Ask questions, tell your story.


If you like my posts, please share them with others and subscribe to this blog.

Personal Improvement – Books That Have Influenced Me Recently

BookList
Books That Influenced Me


I would like to know more about my readers. If you could spare about 2 minutes of your time,  please take a survey to tell me what you like about the blog. Just click here to take the survey.


Welcome back to another installment of Things I Think About! This week I am going to go over a few books that I have read recently that have had an impact. While some of them cover a mix of topics, to me, they mostly fall into one topic. Because of this, I will break them out by topic and detail the crossover topics, and why I feel that way, for each book I also have them listed separately on my Recommended Books page, HERE.


Business

The E Myth Revisited by Michael Gerber

This book speaks to my soul! I “read” the Audible version, (as I do most books due to my 3-hour plus daily commute), recorded by Michael Gerber himself. This book details why a lot of “Entrepreneurs” find themselves overworked, underpaid, and without the ability to grow. It is an interleaved mix of example stories with lessons explaining about each story. The main focus of the book is to explain why developing processes and systems for operating your business will allow you to employ other people to work IN the business so you can work ON the business.


The 4-Hour Workweek by Tim Ferriss

A young Tim Ferriss relates how he figured out how to not be locked into common misconception of the American Dream…go to school, get a good job, work like a slave for 20-30-40 years, then retire at an age where there is a good chance that you will have trouble enjoying life. In the 4-Hour Workweek, he details the concepts of mini-retirements, becoming effective and efficient in whatever you do for work, and ideas for small businesses that require little to no maintenance to support you on an ongoing basis.

Granted, as even pointed out in the book, the goal is not to be able to lay on the beach drinking mai tais, it is to free you up to do the things you want to do, including world travel, learning languages, and/or working with non-profit organizations.

This book also qualifies as a personal Improvement book, because a lot of the recommendations for efficiency and effectiveness while working have helped me to reduce a lot of stress at my main job.


Rich Dad’s Cash Flow Quadrant by Robert Kyosaki

This book breaks out the different classifications of people earning money. ESBI stands for Employees, someone who works for someone else to make money, Self-Employed, a person working for themselves to make money, Business Owners, owning a business & employing other people, and Investors, those who employ their capital to buy assets. It promotes the idea to be either a business owner or, ultimately, an investor, as this usually provides the best returns on time & money.


Personal Improvement

The Obstacle is the Way by Ryan Holiday

Ryan Holiday is a devoted Stoic. He has multiple books and a website dedicated to Stoicism. This book is kind of a manual for achievement. I really enjoy it because it basically lays out my philosophy on life. The short version is “Do what you can to change the things you don’t like in your life…Ignore the things you can’t change.” The Obstacle is the Way takes it a step further in that it guides you to figure out how to change either the situation or your thinking about the “things you can’t change”.


Rich Dad, Poor Dad by Robert Kyosaki

Robert Kyosaki tells the story of how he grew up a poor kid, but due to the tutelage of a friend’s father, learned to become a businessman. The book is a simple read but puts forth important concepts…assets are only assets if they will make you money, don’t spend foolishly, and educate yourself to grow. There is also a good bit of advice on real estate investment as a vehicle to become wealthy.


Principles by Ray Dalio

Ray Dalio is one of the richest men in the world and got that way by building one of the top hedge fund management companies, Bridgewater Associates. In Principles, he relates his lis life and how he got to where he is, developing his principles for business and personal life as an operating system along the way. This is another Audible entry where the author reads the book to you. It works.


Real Estate Investing

Long Distance Real Estate Investing by David Greene

While I don’t invest in real estate outside of my back yard, (for now), this book is incredibly useful as a guide of how to do things. The methodologies and techniques laid out here will work even in a local market. It’s a mix of strategies, tools, and tips to be successful.


The Book on Rental Property Investing by Brandon Turner

This book is a thorough primer for anyone wanting to get into rental properties as an investment. It covers everything from finding properties to rehab tips and beyond.


The Book on Managing Rental Properties by Brandon Turner and Heather Turner

Hmmm…the title sounds a bit familiar…YES! This is the follow-up book to The Book on Rental Property Investing. It picks up where the previous book left off and takes a deeper dive into what you need to do to manage properties successfully.


Loopholes of Real Estate Investing by Garrett Sutton, Rich Dad Advisor

Another Audible author read, Loopholes covers the benefits of and hazards to watch out for when investing in real estate. I have probably listened to this book at least 6 times…right up there with the 4-Hour Workweek and The E Myth revisited. Lots of great advice.


And, as always, let me know what you think in the comments. Ask questions, tell your story.


If you like my posts, please share them with others and subscribe to this blog.

Holiday Lighting – The Automation Technology Used to Run a Show

CMB-24D-Angled
RGB and AC Controller Boards

Welcome back this week. I would still like to understand what you like about this blog and would appreciate you taking this short survey. You can probably finish it in under two minutes. Just click here to take the survey.

Today, I am going to discuss the automation technology that I use to run our holiday light shows. I am using this as motivation to get moving on building additional props for my Halloween show because I have to get it built, then add sequencing to cover the new element in addition to trying to add a new song or two.

SequencingPumpkins
Sequencing View

There are quite a few options for making lights go “blinky-blinky”, but the one I have settled on to start out with is manufactured by a company called Light-O-Rama.  They have lots of options to choose from, so no matter if you are a beginner or an experienced enthusiast, they have products to get you going.

Controller-AC
16 ch. AC Controller

Controllers

There are various things you can do to make your holiday light decorations blink. The first thing I experienced was the “blinker bulb”. It was a special bulb that, when inserted into a string of Christmas lights, made them blink.

The next option that came along was lights with a special controller built into the string that gave you options blinking and shimmering. Other products were a box pre-programmed with songs and they blinked the lights in time with the music but was in no way synchronized with the music as a show. There are also LED bulb strings that change from white to multicolor to blinking multi-color depending on the number of times you press the button on the wireless remote control.

These are all options we have incorporated into our holiday lighting display along the years, with the exception of the preprogrammed music box prior to getting started with the animated light show synchronized to music.

Our first controller was a sixteen channel AC controller. This allowed us to have 16 different light show elements or sets of elements turning on and off, synchronized with music. It is able to handle incandescent and/or LED light strings.

We next added a second AC controller and a twenty-four channel RGB controller. RGB stands for Red, Green, Blue, the three primary color components of a RGB light. By varying the intensity of each component, it changes the color that the RGB element puts out. This is also known as a “Dumb RGB” controller. Since each channel controls a single color in an RGB element, twenty-four channels can control eight RGB elements.

We then added a third sixteen channel AC controller to our setup, giving us a total of forty-eight AC channels and a grand total of seventy-two channels with the RGB controller.

This year, in the off season, we added a second twenty-four channel RGB controller. The plan is to use it to control a  dancing skeleton, my above-mentioned prop I need to build.

Lights

We use a mix of incandescent, LED, and RGB lights (flood lights and RGB strips) in our show. LEDs work out great due to the low power consumption.

We go shopping on the day after Christmas each year to pick up new and backup lights for the show at a 70%-90% discount off of retail pricing. It helps to keep the cost of putting on the show down.

Cables

We initially used extension cords to hook everything up, but it started getting expensive as we added more channels, not to mention that they are bulky and heavy.

SPT1WirePlugs

We now mainly use SPT-1 wire (16-gauge speaker wire) along with vampire plugs to run power to each string of lights.

Automating the Show

Our goal, once we started using the light controllers, was that the show would be totally automated…meaning we would not need to turn it on and off every day. We also wanted to be able to have visitors be able to hear the music, but not have the music bother my neighbors.

So we added a standalone “miniDirector” to run the show and a FM transmitter.

The miniDirector has the sequences and songs saved on a SD card. When the power is turned on by the timer, the miniDirector starts running the show in a loop. It outputs the audio to the FM transmitter so viewers can hear the music right in their cars and it outputs the sequencing signals to the controller via serial connection using cat-5 cable. All the controllers are linked together in this way.

Now the show runs at the programmed time with no need to keep a separate computer running to drive it.

Well that about wraps it up for what we use to automate our holiday light show. Below are videos of some of the sequences:

Videos

This is Halloween – Full

[youtube https://www.youtube.com/watch?v=6tpE76pop3o]

Carol of the Bells – Full

[youtube https://www.youtube.com/watch?v=zzFTO-pTNug]

Dragula – Full

[youtube https://www.youtube.com/watch?v=H9ig8tNIxUc]

This is Halloween – Clip

[youtube https://www.youtube.com/watch?v=l06qcycc648?start=166]

And, as always, let me know what you think in the comments. Ask questions, tell your story.

If you like my posts, please share them with others and subscribe to this blog.

Drilling Automation: Why Aren’t We Further Along?

Current level of Drilling Automation


This week I am going to attempt to provide some answers to the question of “Why we aren’t further along with implementing Drilling Automation?”.
The thing that got me started thinking about this topic was an article in the Journal of Petroleum Technology discussing data accuracy, mainly a paper recently presented at the IADC/SPE Drilling Conference. The topic of that paper was An Algorithm to Automatically Zero Weight on Bit and DifferentialPressure and Resulting Improvements in Data Quality
Abstract: SPE189636-MS
The paper details a study by Pason, a company that collects, analyzes, and distributes real time and historical drilling data from rigs in North America. They conducted a study on the accuracy of Weight On Bit measurements and determined that the majority of the WOB data was incorrect due to drillers not properly zeroing the WOB indicator. They proceeded to develop an automated algorithm that zeroed the WOB and another key measurement, differential pressure. This improved the accuracy of the data collected immensely.
The thing in the JPT article that caught my eye was the question, paraphrased here, “What is keeping the industry, as a whole, from collecting more accurate data?” The main answer seems to be that collecting more accurate data is not free. Due to needing to utilize more accurate sensors and having, at minimum, personnel regularly recalibrate those sensors, to developing better sensors and systems, it all costs more money than the current standard provided.
This is a parallel to what we are seeing as a hindrance to progressing with Drilling Automation. Operators want the lowest price they can get to drill their wells, service & equipment providers want the highest price they can get for their equipment, products, & services, and in most cases, what you wind up getting is low-cost provider solution (read minimum quality for cheapest price).
In recent history, most operators have not wanted to help develop new technology and/or practices. While you do see companies like Statoil, Royal Dutch Shell, Apache, and others investing in drilling automation projects and sometimes partnering with service providers to do this, the majority do not.
I think part of the reason why we are not seeing large scale advancements with Drilling Automation is that there is not one entity in control of the entire operation. Factory automation is far easier for at least two reasons: Factories are usually controlled by a single entity and the tasks that are automated are simple, repeatable steps.
Drilling a well is not the same as operating a robotic factory. You can automate a lot of things that are repetitive and can be accomplished by robots. Drilling a well is not the case. There are exponentially more variables involved with drilling a well than welding pieces of a car together. Due to that expansive number of variables, changes in each multiply the contingencies and potential responses needed. To sum it up, it is not an easy task to accomplish. Not impossible, mind you, just not easy.
A lot of wells involve a minimum of three or four different companies working to drill the well. All with different goals and business models. That adds to the complexity. This can be somewhat caveated by Red or Blue rig models where a single service company provides most or all of the various services to the operator on the rig, OR the independent Operator model where they hire their own consultants and utilize third-party suppliers for equipment & products.
So, because of all this complexity, in addition to variations in the market (read: Current, hopefully over, crash in the industry), it makes it hard to make progress with drilling automation.
BUT, there are changes afoot! Industry conferences are starting to highlight Drilling Automation. More companies are becoming involved in the space. With the progress being seen in artificial intelligence, things that someone had to “feel” or “intuit” may soon be reduced to a routine validated by a computer algorithm.
We are starting to see progress. Interest from multiple players, large and small. Companies transferring their expertise from wetware to hardware and software. The singularity for Drilling Automation is not tomorrow. We may never get to a totally automated drilling process with no human involvement, but if we can get 95% there, that will be a huge reduction in cost and increase in efficiency!
And, as always, let me know what you think in the comments. Ask questions, tell your story.
If you like my posts, please share them with others and subscribe to this blog.

Oilfield Automation: Where Do We Go From Here?


I was able to attend a Plenary Panel at the 2018 AADE National Fluids Technical Conference and Exhibition on the topic of Automation and Digital Work Transformations for Drilling and Completions – ‘How Far and How Much in the Low-for-Longer Market Setting?’ this week.
The format was 4 panelists from various segments of the industry, each giving about a 10-minute presentation, then the audience was broken out into groups to discuss the content of the presentations. The panelists moved around the room and listened in to each groups discussion, offering commentary.
Brad Cage, a completions engineer with Devon Energy, reviewed Devon’s path with working towards the digital transformation of their completions process. He shared steps and outcomes for that journey, resulting in a more efficient and lower cost completion.
Alan Rodgerson, a Fluids Advisor with BP, detailed BP’s progress with 2020 plan for automation. The main takeaway was that it wasn’t as clear-cut as it seemed at the outset. There is a difference between Automation and Mechanization.
Amir Bar, with Halliburton, highlighted the need for attention to the “People” side of automation and digital transformation.
Eric Griffith, with PDS Petrotechnical, discussed the need for data format standards adoption among operators and service companies.
Once the presentations were complete, the audience attendees were allowed to break into groups to discuss their thoughts on the panel’s presentations.
Those varied from a group of students recognizing the need for automation, but also concerned about job displacement to the need for accurate sensors to capture accurate data, to concerns on how the implementation of automation will impact certain jobs where there is already a gap between experienced practitioners (read: older hands) who resist technology and novice practitioners who innately understand technology but don’t yet have the experience to equal the other group.
Overall, the whole session was thought-provoking and a great session to attend.
I had many thoughts on the various subjects and concerns brought up. I will probably cover them at some point in other articles, but I wanted to cover this because it is one that I have not seen covered in-depth.
How do we transition to full automation for the jobs involved in drilling?
I have heard it said that we already are starting to transition some of the jobs with things like iron roughnecks and pipe handlers, but fully automated versions of these are not the norm. In most cases, on rigs where they are present, their actions are initiated and controlled by people. I am not sure if the cost of running a fully automated (Level 6, according to Dr.William L. Koederitz, SPE, PE) version has not dropped below the cost of utilizing people to operate them or other factors are at play. Either way, we aren’t there yet.
There are a lot of people that will say that you can never automate this job or that job, but ultimately, it may not be a matter of automating the job. It may be a case of finding a way to get the same results without having to do the job at all. Automating a manual process can be done, but does it make sense for it to be done? You can read about an attempt to do just that in this previous post.
I think, eventually, we will have at least three separate stages for moving to general use full automation in the drilling industry:
Piecemeal Task Automation
 
Specific systems will be automated to reduce risk, improve repeatability, remove the “human error” factor. We are at the beginning stages of this phase. We have auto-drillers, companies working on autonomous drilling advisory systems for geosteering, prototype systems for controlling pipe movement when tripping, based on formation limitations (There may be implementations beyond the prototype stage at this point), and there are probably more than a couple fully-automated pipe-handling equipment providers out there.
More General Automation
 
Most rig systems will be fully automated with oversight by a smaller skilled crew. The domain experts that used to reside on the rig, (relative to this phase), are monitoring operations remotely and tweaking recommendations to optimize performance, assisted by an AI advisor. Service companies will provide technicians who will do rig-up, rig down, and maintenance on equipment.
Full Automation
 
Rig is fully automated and houses no personnel. Potentially operates sub-sea, thousands of feet underwater, or even on another planet/moon/asteroid. Systems are fully autonomous and self-correcting. May not even be in the business of exploring for hydrocarbons. (We might all have backyard nuclear reactors powering everything we need.)
And, as always, let me know what you think in the comments. Ask questions, tell your story.
If you like my posts, please share them with others and subscribe to this blog.

Equipment Automation – Drilling Fluids

Various pictures of industrial and oilfield automation. The bottom center, top center, and bottom right images are of the DRU.


Today’s topic has to do with Equipment Automation, and more specifically, Drilling Fluids Equipment Automation.
First, a brief history of drilling technology:
  • Early drilling systems used the equivalent of a heavy chisel hanging on a cable down in a hole to “drill” for oil. The “cable drill” would be raised and lowered rapidly to break the rock, thus deepening the hole.
  • Later systems put a bit on the end of lengths of pipe and rotated the pipe to deepen the hole.
  • Drilling fluids were introduced to cool & lubricate the bit and carry the cuttings out of the hole. They were consisting of water and other chemicals to maintain density and viscosity.
  • Invert Emulsion Muds (IEM) were later developed to further inhibit interaction between the drilling fluids and the formation being drilled.


The main tools used to maintain the drilling fluids were a rheometer, a tool developed to test the viscosity of paints to ensure the pigment particles remained suspended, and the mud balance, a tool used to measure the density of a fluid.
***The above history does not contain all innovations, reasons, or details***
Up until 2015, the mud balance and the rheometer were still the two main tools used to monitor the properties of drilling fluids. They additionally use other tools, such as retorts to determine the fractional content of oil, water, and solids in a fluid, chemical titration to test things like alkalinity, calcium content, & chlorides content, in addition to HTHP filter press, a tool used to measure how much of the liquid portion of a drilling fluid will “leak out” through a porous medium, usually filter paper, across a standard differential pressure.
Prior to 2015, quite a few companies have worked on automating drilling fluids testing, including the company I work for, Baroid, a part of Halliburton.
**Disclaimer: I am part of the group that worked on this**
The testing covered varied from density meters to simulated viscosity to solids analysis. The main issue was that the results were either inaccurate or the specific test itself was not necessarily a must-have.
We initially built or had built various automated prototypes of testing apparatus. One was a fully automated retort. If you are not familiar with a retort, it is designed to bake the liquid out of a measured volume of fluid at a high enough temperature to also separate out oil and water content. This test allows drilling fluids engineers (or mud engineers) to determine how much oil, water, and solids are in a fluid. It also allows them to calculate the amount of high gravity solids (desired) and low gravity solids (not so desired) contained within the fluid. The approach the company we contracted for a prototype took was to just automate the manual process. So the result was a big box that took in a measured amount of fluid, cooked off the liquid, reheated the liquid to separate the oil and water, then used LASERS! to measure the amount of oil and water.
They had also included a mini-CNC arm inside the box, specifically for the cleanup part. It would pick up a “retort spatula” attachment to scrape the dried mud residue from inside the retort cell, then it would pick up the wire brush attachment to get the final bits of dried mud from the cell walls. There was a vacuum component that sucked up all of the dried mud residue and dust while the cleaning operation was going on. It was kind of amazing to watch!
Alas, as amazing as it was to watch, it was not practical as a field application precisely due to the amount of moving parts…there were way too many things to break down. Too many things needing hands-on attention during its operation. When a piece of equipment like this is sitting 100 miles offshore, that is too isolated to be able to send someone every couple of days to clean it out or fix something.
We realized that we needed to focus on the critical measurements for running drilling fluids. The properties measured on the most frequent basis are density and rheology. Additionally, as part of the automation strategy we developed, density, rheology, and fluid temperature are the primary inputs for our real time drilling and hydraulics simulator.
Our first unit was dubbed RTDV, Real Time Density & Viscosity. It was a good start, but was not able to provide us with accurate results. Based on extensive analysis of the RTDVs operation, we started a redesign project based on lessons learned. The biggest issues were lack of continuous unattended operation, inaccurate rheology readings, and the ability for air or gas entrainment to affect the density readings.
The next generation unit was named DRU or Density Rheology Unit. It captures a pressurized density, approximately every 1-2 minutes, and a full 6-speed rheology every 10-20 minutes, depending on ambient fluid temperatures because it heats the fluid to a set testing temperature.
It was deployed on late 2015 on a commercial basis and received industry press and awards on 2016.
Our goal is to automate all fluid testing. What’s funny is that when we say that, drilling fluids engineers ask if we are trying to get rid of their jobs. That is just short-sighted thinking.
As things currently stand, in a 24 hour period, just to accomplish the standard required tests, it takes about 6 hours. That’s a full 25% of the day spent in a lab, possibly not paying attention to operations. And that is for only four sets of test results.
Yes, there are opportunities to check on things while tests are running, BUT, What if the fluids engineers didn’t have too spend all that time conducting tests? And what if they could see those test results more frequently? How much better could they maintain the fluid properties?
There are other companies coming out with new technology and have the ability to measure a few properties, but I don’t think that they have the broad vision for an integrated suite of sensors in addition to a plan on what to do with the data once it is captured.
But I do.
But we do.
Look to the future…

Let me know what you think in the comments. Ask questions, tell your story.

If you like my posts, please share them with others and subscribe to this blog.

Verified by MonsterInsights