Automation – Data Frequency: How “Real Time” Is Real Time?

Happy Finter from South Louisiana! Fall started to show up, but winter was riding shotgun! We went from highs of 81 degrees F / 27.22 degrees C to 45 degrees F / 7.22 degrees C AND clouds and rain. Christmas light show can wait a few more days to get set up.

Today we are going to go over Data Frequency and how it relates to aspects of drilling automation. How often we receive a data point for a given channel or curve.


Variations on Real Time


Ask someone what their definition of real time is and depending on their particular needs, you will get different answers. Some people feel that getting mud report data as checks are made is real time enough to keep them informed.

Others feel that getting a WITSML 1.3.x, (Wellsite Information Transfer Standard Markup Language), data feed that updates every ten to thirty seconds will be just fine.

Then there are others who are used to seeing the rig default of data coming in every 5 seconds and that is great!

Finally, there are those who opine for sub-second data frequencies to ensure valid tracking of rig component movement and calculations.

Depending on your particular needs, any of these might be valid. For a comprehensive approach, the platform should take into account the needs and requirements for the types of data being captured. It should be able to accommodate sensors or inputs that generate anything from one data point per day down to many data points per second.


(Just as an aside, I really like the way WITSML 2.x and ETP are shaping up for real time data)

I would like to know more about my readers. If you could spare about 2 minutes of your time, please take a survey to tell me what you like about the blog. Just click here to take the survey.

Data Frequency

The type of data should drive the frequency of data capture, in addition to what the usage of the data will be.

Some data doesn’t change very fast, so it does not need to be updated very frequently.

Things like wellbore and drill string geometry, fluid properties, and positioning data do not need to be updated every second or few seconds. In the case of drilling fluids, Density updates every one to two minutes is a decent frequency, whereas the oil/water ratio does not need to be updated as frequently.

Other data is constantly changing and depending the particular sensor, could indeed warrant the need for sub-second frequency data.


A good example for that need would be block position, which is used to calculate running speed or pipe acceleration. This is, in turn, utilized to calculate tripping hydraulics in real time.

The benefit of having the ability to do this based on sub-second data allows for simulating the micro-movement of pipe in tight window scenarios…too much down hole pressure, the formation breaks down, causing fluid losses and too little down hole pressure, the formation fluids/gases come into the wellbore, thus inducing a kick.


Logical Assumptions & Why It Matters


Not all data needs to be updated at a high frequency. As indicated in the above section, data frequency depends on how often the data changes. The higher the change rate, the higher the data frequency needs to be.

The main reasoning behind this idea is that you may miss significant changes in the data if your sampling frequency is too slow.

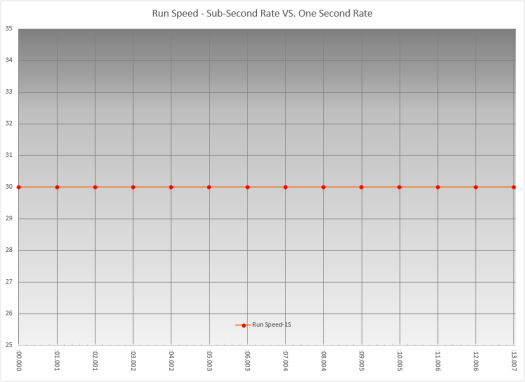
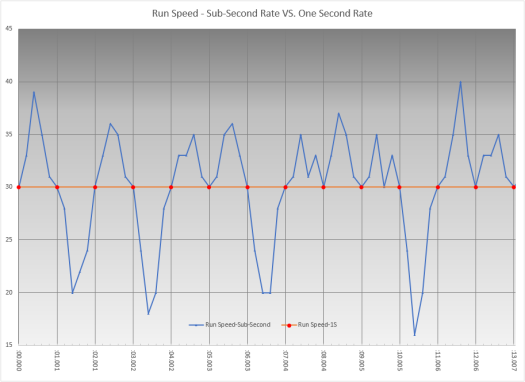
Below is an exaggerated example of missing changes to pipe acceleration (or Running Speed) due to sampling frequency. The data is fabricated, for illustrative purposes.
 

RunSpd-1s


In the image above, the running speed is a straight thirty feet per minute, with a data frequency of one data point per second. Everything appears smooth, with no issues.
 

RunSpd-SSv1s


In this image, I’ve added sub-second data to show that the smooth, steady running speed was actually not very smooth, it just appears that way due to when the data points were captured.


Because this data is not captured, it is not thought to have occurred. But if you don’t have visibility of it, you can’t know it is there.


The examples above are made up & exaggerated to prove the point. I have seen this play out over different data points in the drilling arena.

When we were first attempting to develop the Applied Fluids Optimization service, our original software would calculate tripping hydraulics at a one second frequency, but would only capture the data at a thirty second frequency. Running speed spikes would lead the software to calculate and display large pressure variations. When we would try to show these excursions after the fact, we could not because the thirty second frequency did not coincide with the actual deviations.

One more fluids-related example: Fluid density on a land rig. Land rigs are an exercise in economy, from an offshore drilling perspective. The rig crews are smaller, so there are less people to do a set number of jobs. The mud pits are smaller, contributing to the total circulating system being smaller. Because of this, it allows for less significant events to impact the fluid properties. The derrick hand is busy? He can’t dust up the density. The shaker hand is up on the floor making a connection? He didn’t adjust the flow on the shakers. Small system, less attention, more chance for changes.

The mud engineer, (person responsible for keeping the drilling fluid running within specifications), should be running four mud checks a day. So, we should see, at minimum, four density measurements…one every six hours. When we were conducting field testing on the DRU, we noticed that we had lots of variation and excursions in the density reading from the DRU where the mud engineer’s data showed fairly smooth trends. When we overlaid the two data sets, the mud engineer’s data matched almost exactly with the DRU readings, just that it missed the excursions.


Takeaways

  • More frequent data helps you to better understand what is going on
  • Depending on the environment, a data curve may need a higher frequency
  • Some data does not need to be high frequency
  • Choose your data focus wisely


And, as always, let me know what you think in the comments. Ask questions, tell your story.

If you like my posts, please share them with others and subscribe to this blog.

Drilling Automation: Why Aren’t We Further Along?

Current level of Drilling Automation


This week I am going to attempt to provide some answers to the question of “Why we aren’t further along with implementing Drilling Automation?”.
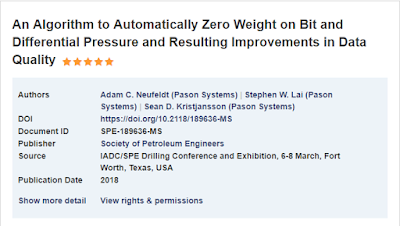
The thing that got me started thinking about this topic was an article in the Journal of Petroleum Technology discussing data accuracy, mainly a paper recently presented at the IADC/SPE Drilling Conference. The topic of that paper was An Algorithm to Automatically Zero Weight on Bit and DifferentialPressure and Resulting Improvements in Data Quality
Abstract: SPE189636-MS
The paper details a study by Pason, a company that collects, analyzes, and distributes real time and historical drilling data from rigs in North America. They conducted a study on the accuracy of Weight On Bit measurements and determined that the majority of the WOB data was incorrect due to drillers not properly zeroing the WOB indicator. They proceeded to develop an automated algorithm that zeroed the WOB and another key measurement, differential pressure. This improved the accuracy of the data collected immensely.
The thing in the JPT article that caught my eye was the question, paraphrased here, “What is keeping the industry, as a whole, from collecting more accurate data?” The main answer seems to be that collecting more accurate data is not free. Due to needing to utilize more accurate sensors and having, at minimum, personnel regularly recalibrate those sensors, to developing better sensors and systems, it all costs more money than the current standard provided.
This is a parallel to what we are seeing as a hindrance to progressing with Drilling Automation. Operators want the lowest price they can get to drill their wells, service & equipment providers want the highest price they can get for their equipment, products, & services, and in most cases, what you wind up getting is low-cost provider solution (read minimum quality for cheapest price).
In recent history, most operators have not wanted to help develop new technology and/or practices. While you do see companies like Statoil, Royal Dutch Shell, Apache, and others investing in drilling automation projects and sometimes partnering with service providers to do this, the majority do not.
I think part of the reason why we are not seeing large scale advancements with Drilling Automation is that there is not one entity in control of the entire operation. Factory automation is far easier for at least two reasons: Factories are usually controlled by a single entity and the tasks that are automated are simple, repeatable steps.
Drilling a well is not the same as operating a robotic factory. You can automate a lot of things that are repetitive and can be accomplished by robots. Drilling a well is not the case. There are exponentially more variables involved with drilling a well than welding pieces of a car together. Due to that expansive number of variables, changes in each multiply the contingencies and potential responses needed. To sum it up, it is not an easy task to accomplish. Not impossible, mind you, just not easy.
A lot of wells involve a minimum of three or four different companies working to drill the well. All with different goals and business models. That adds to the complexity. This can be somewhat caveated by Red or Blue rig models where a single service company provides most or all of the various services to the operator on the rig, OR the independent Operator model where they hire their own consultants and utilize third-party suppliers for equipment & products.
So, because of all this complexity, in addition to variations in the market (read: Current, hopefully over, crash in the industry), it makes it hard to make progress with drilling automation.
BUT, there are changes afoot! Industry conferences are starting to highlight Drilling Automation. More companies are becoming involved in the space. With the progress being seen in artificial intelligence, things that someone had to “feel” or “intuit” may soon be reduced to a routine validated by a computer algorithm.
We are starting to see progress. Interest from multiple players, large and small. Companies transferring their expertise from wetware to hardware and software. The singularity for Drilling Automation is not tomorrow. We may never get to a totally automated drilling process with no human involvement, but if we can get 95% there, that will be a huge reduction in cost and increase in efficiency!
And, as always, let me know what you think in the comments. Ask questions, tell your story.
If you like my posts, please share them with others and subscribe to this blog.
Oilfield Automation: Where Do We Go From Here?


I was able to attend a Plenary Panel at the 2018 AADE National Fluids Technical Conference and Exhibition on the topic of Automation and Digital Work Transformations for Drilling and Completions – ‘How Far and How Much in the Low-for-Longer Market Setting?’ this week.
The format was 4 panelists from various segments of the industry, each giving about a 10-minute presentation, then the audience was broken out into groups to discuss the content of the presentations. The panelists moved around the room and listened in to each groups discussion, offering commentary.
Brad Cage, a completions engineer with Devon Energy, reviewed Devon’s path with working towards the digital transformation of their completions process. He shared steps and outcomes for that journey, resulting in a more efficient and lower cost completion.
Alan Rodgerson, a Fluids Advisor with BP, detailed BP’s progress with 2020 plan for automation. The main takeaway was that it wasn’t as clear-cut as it seemed at the outset. There is a difference between Automation and Mechanization.
Amir Bar, with Halliburton, highlighted the need for attention to the “People” side of automation and digital transformation.
Eric Griffith, with PDS Petrotechnical, discussed the need for data format standards adoption among operators and service companies.
Once the presentations were complete, the audience attendees were allowed to break into groups to discuss their thoughts on the panel’s presentations.
Those varied from a group of students recognizing the need for automation, but also concerned about job displacement to the need for accurate sensors to capture accurate data, to concerns on how the implementation of automation will impact certain jobs where there is already a gap between experienced practitioners (read: older hands) who resist technology and novice practitioners who innately understand technology but don’t yet have the experience to equal the other group.
Overall, the whole session was thought-provoking and a great session to attend.
I had many thoughts on the various subjects and concerns brought up. I will probably cover them at some point in other articles, but I wanted to cover this because it is one that I have not seen covered in-depth.
How do we transition to full automation for the jobs involved in drilling?
I have heard it said that we already are starting to transition some of the jobs with things like iron roughnecks and pipe handlers, but fully automated versions of these are not the norm. In most cases, on rigs where they are present, their actions are initiated and controlled by people. I am not sure if the cost of running a fully automated (Level 6, according to Dr.William L. Koederitz, SPE, PE) version has not dropped below the cost of utilizing people to operate them or other factors are at play. Either way, we aren’t there yet.
There are a lot of people that will say that you can never automate this job or that job, but ultimately, it may not be a matter of automating the job. It may be a case of finding a way to get the same results without having to do the job at all. Automating a manual process can be done, but does it make sense for it to be done? You can read about an attempt to do just that in this previous post.
I think, eventually, we will have at least three separate stages for moving to general use full automation in the drilling industry:
Piecemeal Task Automation
 
Specific systems will be automated to reduce risk, improve repeatability, remove the “human error” factor. We are at the beginning stages of this phase. We have auto-drillers, companies working on autonomous drilling advisory systems for geosteering, prototype systems for controlling pipe movement when tripping, based on formation limitations (There may be implementations beyond the prototype stage at this point), and there are probably more than a couple fully-automated pipe-handling equipment providers out there.
More General Automation
 
Most rig systems will be fully automated with oversight by a smaller skilled crew. The domain experts that used to reside on the rig, (relative to this phase), are monitoring operations remotely and tweaking recommendations to optimize performance, assisted by an AI advisor. Service companies will provide technicians who will do rig-up, rig down, and maintenance on equipment.
Full Automation
 
Rig is fully automated and houses no personnel. Potentially operates sub-sea, thousands of feet underwater, or even on another planet/moon/asteroid. Systems are fully autonomous and self-correcting. May not even be in the business of exploring for hydrocarbons. (We might all have backyard nuclear reactors powering everything we need.)
And, as always, let me know what you think in the comments. Ask questions, tell your story.
If you like my posts, please share them with others and subscribe to this blog.
Equipment Automation – Drilling Fluids

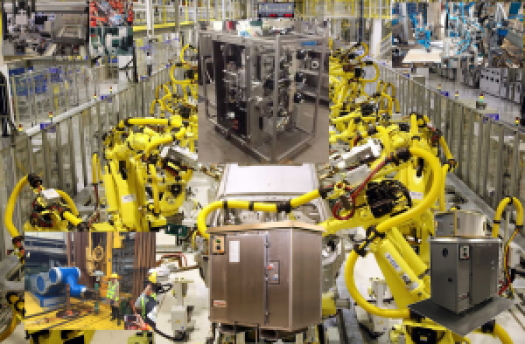
Various pictures of industrial and oilfield automation. The bottom center, top center, and bottom right images are of the DRU.


Today’s topic has to do with Equipment Automation, and more specifically, Drilling Fluids Equipment Automation.
First, a brief history of drilling technology:
  • Early drilling systems used the equivalent of a heavy chisel hanging on a cable down in a hole to “drill” for oil. The “cable drill” would be raised and lowered rapidly to break the rock, thus deepening the hole.
  • Later systems put a bit on the end of lengths of pipe and rotated the pipe to deepen the hole.
  • Drilling fluids were introduced to cool & lubricate the bit and carry the cuttings out of the hole. They were consisting of water and other chemicals to maintain density and viscosity.
  • Invert Emulsion Muds (IEM) were later developed to further inhibit interaction between the drilling fluids and the formation being drilled.


The main tools used to maintain the drilling fluids were a rheometer, a tool developed to test the viscosity of paints to ensure the pigment particles remained suspended, and the mud balance, a tool used to measure the density of a fluid.
***The above history does not contain all innovations, reasons, or details***
Up until 2015, the mud balance and the rheometer were still the two main tools used to monitor the properties of drilling fluids. They additionally use other tools, such as retorts to determine the fractional content of oil, water, and solids in a fluid, chemical titration to test things like alkalinity, calcium content, & chlorides content, in addition to HTHP filter press, a tool used to measure how much of the liquid portion of a drilling fluid will “leak out” through a porous medium, usually filter paper, across a standard differential pressure.
Prior to 2015, quite a few companies have worked on automating drilling fluids testing, including the company I work for, Baroid, a part of Halliburton.
**Disclaimer: I am part of the group that worked on this**
The testing covered varied from density meters to simulated viscosity to solids analysis. The main issue was that the results were either inaccurate or the specific test itself was not necessarily a must-have.
We initially built or had built various automated prototypes of testing apparatus. One was a fully automated retort. If you are not familiar with a retort, it is designed to bake the liquid out of a measured volume of fluid at a high enough temperature to also separate out oil and water content. This test allows drilling fluids engineers (or mud engineers) to determine how much oil, water, and solids are in a fluid. It also allows them to calculate the amount of high gravity solids (desired) and low gravity solids (not so desired) contained within the fluid. The approach the company we contracted for a prototype took was to just automate the manual process. So the result was a big box that took in a measured amount of fluid, cooked off the liquid, reheated the liquid to separate the oil and water, then used LASERS! to measure the amount of oil and water.
They had also included a mini-CNC arm inside the box, specifically for the cleanup part. It would pick up a “retort spatula” attachment to scrape the dried mud residue from inside the retort cell, then it would pick up the wire brush attachment to get the final bits of dried mud from the cell walls. There was a vacuum component that sucked up all of the dried mud residue and dust while the cleaning operation was going on. It was kind of amazing to watch!
Alas, as amazing as it was to watch, it was not practical as a field application precisely due to the amount of moving parts…there were way too many things to break down. Too many things needing hands-on attention during its operation. When a piece of equipment like this is sitting 100 miles offshore, that is too isolated to be able to send someone every couple of days to clean it out or fix something.
We realized that we needed to focus on the critical measurements for running drilling fluids. The properties measured on the most frequent basis are density and rheology. Additionally, as part of the automation strategy we developed, density, rheology, and fluid temperature are the primary inputs for our real time drilling and hydraulics simulator.
Our first unit was dubbed RTDV, Real Time Density & Viscosity. It was a good start, but was not able to provide us with accurate results. Based on extensive analysis of the RTDVs operation, we started a redesign project based on lessons learned. The biggest issues were lack of continuous unattended operation, inaccurate rheology readings, and the ability for air or gas entrainment to affect the density readings.
The next generation unit was named DRU or Density Rheology Unit. It captures a pressurized density, approximately every 1-2 minutes, and a full 6-speed rheology every 10-20 minutes, depending on ambient fluid temperatures because it heats the fluid to a set testing temperature.
It was deployed on late 2015 on a commercial basis and received industry press and awards on 2016.
Our goal is to automate all fluid testing. What’s funny is that when we say that, drilling fluids engineers ask if we are trying to get rid of their jobs. That is just short-sighted thinking.
As things currently stand, in a 24 hour period, just to accomplish the standard required tests, it takes about 6 hours. That’s a full 25% of the day spent in a lab, possibly not paying attention to operations. And that is for only four sets of test results.
Yes, there are opportunities to check on things while tests are running, BUT, What if the fluids engineers didn’t have too spend all that time conducting tests? And what if they could see those test results more frequently? How much better could they maintain the fluid properties?
There are other companies coming out with new technology and have the ability to measure a few properties, but I don’t think that they have the broad vision for an integrated suite of sensors in addition to a plan on what to do with the data once it is captured.
But I do.
But we do.
Look to the future…

Let me know what you think in the comments. Ask questions, tell your story.

If you like my posts, please share them with others and subscribe to this blog.

Verified by MonsterInsights