
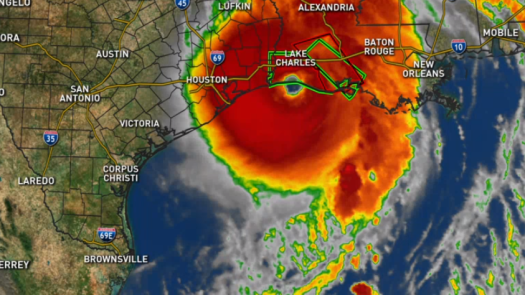
For those of you unfamiliar with where I live in relation to the path of Hurricane Laura, we are located just under the “O” in New Orleans in the map above. We are fine and so far, have only gotten wind and rain here. Very grateful that the we have been spared this time.
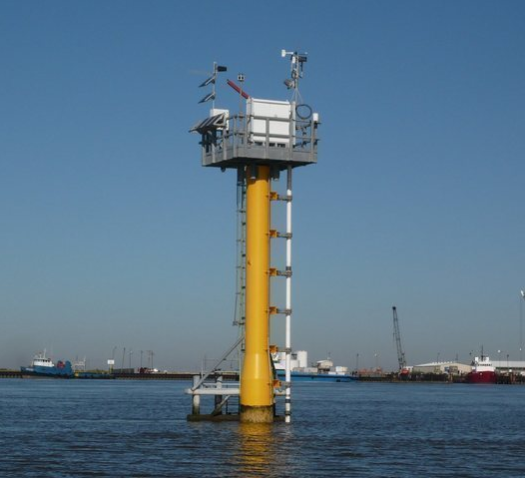
Now to the meat of this article…a buddy of mine, (Shawn Abney), posted a link to Facebook for the Calcasieu Pass Tide/Current/Weather sensor array run by NOAA Center for Operational Oceanographic Products and Services. He pointed out that the data was available for the point of impact for Hurricane Laura’s landfall. I took a look and was amazed at what I could discern from the data provided.
I’ll present the charts for the specific measurements and what I can infer from them below.
Location
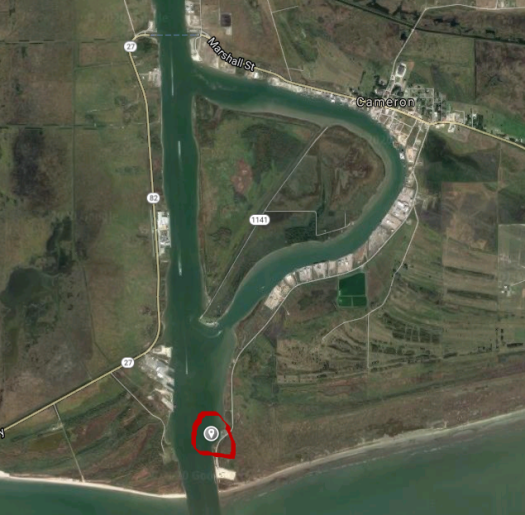
“Where in the hell is this sensor array?” you might ask. It sits just inside the mouth of Calcasieu Pass, below Cameron in Cameron Parish, La. It is just “up the bayou”, as we like to say in the Houma-Thibodaux area, from the public fishing pier. See the map below:
This station collects a lot of data and is part of a network of data collection sites across the Gulf Coast that can show tidal effects for storms or be used for planning when or where to fish.
Another point I want to make before I get started is that this is raw data that has not been QC-checked. What this means is that a sensor may have been off or in the case of the maximum water depths, it is just the raw measurement, not the actual amount of surge. See the raw data statement from the site, below:
These raw data have not been subjected to the National Ocean Service’s quality control or quality assurance procedures and do not meet the criteria and standards of official National Ocean Service data. They are released for limited public use as preliminary data to be used only with appropriate caution.
NOAA CO-OPS Station Page
Tidal Height
So, based on tidal height measured, we can infer storm surge height. Based on the chart below, at landfall (+/- 01:00 or 1:00 AM), Laura showed a tidal height of 11.07 feet maximum. I believe these points are measured every six minutes, so it is a fairly high data frequency to infer from. The predicted tidal height was 2.19 feet at the maximum measured tidal height. Based on a non-scientific observation of the previous month’s data, the actual measured data can sometimes be up to 1.5 feet or so higher than the predicted tidal height. Based on this, the storm surge height inferred from this preliminary data was somewhere between 7.4 feet and 8.9 feet. (Caveat: This is just me looking at the data without knowing how NOAA actually calculates storm surge.)

Wind Speed / Direction
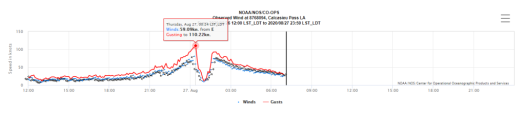
The next chart shows sustained wind speed, gusts, and wind direction. It’s kind of a neat chart in that you can see the sustained wind was blowing in one direction as the storm approach landfall, then drops off to almost nothing as the eye passes over the measurement station, then picks up again with the wind blowing in the opposite direction as the eye departs.
The maximum sustained winds measured at landfall were 69 knots or 79.4 miles per hour with the maximum gusts measured at 110 knots or 126.8 miles per hour.
Air Temperature
The air temperature is interesting in that you can see the temperature dropping as the storm gets closer to landfall, then rises a few degrees as the eye passes, then drops again as the winds pick up. As the storm passes, it gradually rises back to ambient.

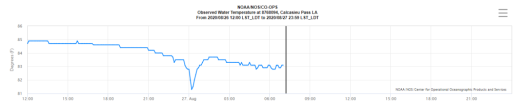
Water Temperature
You can observe the water temperature changes as the storm surge rolls in bringing cooler “offshore” water to the local area, dropping the temperature. I suspect the continued drop in temperature may be contributed to by rainfall and runoff/flowback from the inland flooding.
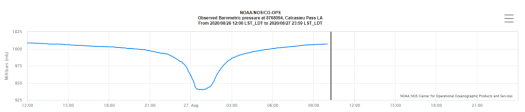
Barometric Pressure
Barometric Pressure is another parameter measured by the station and it is interesting not so much for variation, but to see how far the pressure dropped. Initially, the chart only data down to about 980 millibar. Someone must have updated the chart range because as I am writing this, the chart now shows data with a lowest point of 940 millibar. That is low!
Hopefully this provided a little insight into data interpretation and helps you to understand data and data interpretation better.
And, as always, let me know what you think in the comments. Ask questions, tell your story.
If you like my posts, please share them with others and subscribe to this blog.
Discover more from The Clint Galliano
Subscribe to get the latest posts sent to your email.
Interesting info Clint; gotta love the details put into it making it easy to understand your interpretation.